Best Data Visualization Software to Use in 2024
Let’s have a look at a set of 7 different data visualization software that will allow you to create a digital and graphic masterpiece from your collection of data with ease.
When it comes to creating visual representations of massive data sets, data visualization software provides designers with a simpler approach to do this task. Automating the process of constructing a visualization, at least in part, makes the work of a designer substantially simpler. This is especially true when dealing with data sets that include hundreds of thousands or millions of data points.
These representations may then be used for a number of applications, including but not limited to dashboards, yearly reports, sales and marketing materials, investor slide presentations, and nearly any other situation in which information has to be evaluated promptly.
Very seldom is the process of creating visualization uncomplicated. It is not as if designers can just take a data collection that has thousands of records and generate a visualization from the ground up. No doubt that it is feasible; nevertheless, who would want to spend dozens or even hundreds of hours charting dots on a scatter chart? Exactly this is where data visualization software comes into play. Let’s learn more about some of the top tools right below.
7 Best Data Visualization Tools in 2024
In the coming sections of this guide, we will have a look at some of the most amazing, most awarded, and widely praised data visualization software of all time. Different tools may offer different features, catering to the requirements of different users. Hence, we suggest that you go through the entire list, check out individual product offerings, and then use the one that suits your expectations and requirements the most.
1. RAW
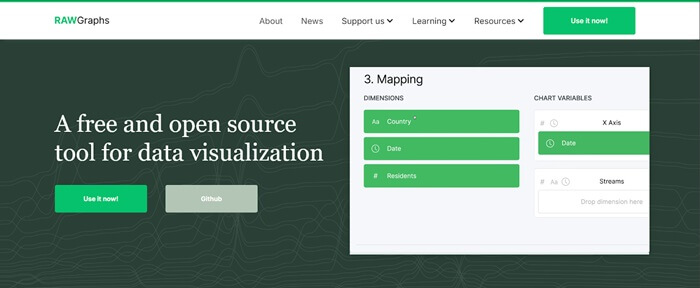
Here’s the first data visualization software on this list of tools. Using data, like a CSV file or TSV file, RAW (which is more often known as RawGraphs) generates graphs. In other words, it acts as a bridge between spreadsheets and data visualization. In spite of the fact that this is an application that operates on the web, RawGraphs offers the highest level of data protection possible. It offers a variety of layouts, both standard and non-traditional. Thus making it one of the best data visualization tools.
Get More Details Related to the Tool Here
2. Visual.ly
When it comes to the best data visualization software, you can not skip this tool. One of the best solutions now available on the market is Visual.ly, which is well-known for its remarkable distribution network that effectively depicts the results of projects. Visual.ly accelerates the process of data input and outsourcing, even to third parties, by employing a specialized creative team for services this smart alternative among the data visualization platforms provides.
Get More Details Related to the Tool Here
Also know: How to Recover Deleted Data from Pen Drive/USB With and Without Software
3. Charts from Google
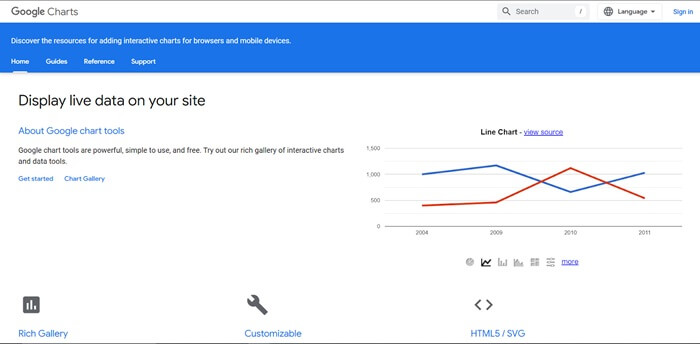
Charts is the next name on this list of the best data visualization software. Using its capacity to generate graphical and pictorial data visualizations, Google Charts is widely recognized as one of the most important players in the data visualization market area. It is developed using SVG & HTML5, and it is renowned for its capabilities. Zoom feature is included in Charts, and it gives customers unrivaled cross-platform compatibility with mobile platforms such as iOS and/or Android, as well as older versions of the IE web browser. You can give this tool a try if you are looking for the best data visualization tools.
Get More Details Related to the Tool Here
4. Reports from Zoho
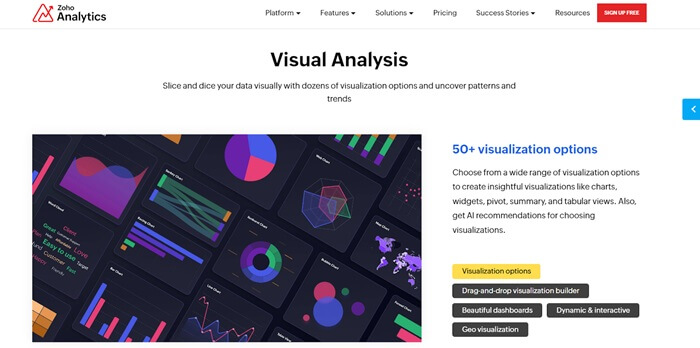
Zoho is well-known for offering digital solutions. One such data visualization software from this developer is Reports. Reports from ZOHO, which is also known as Zoho Analytics, is an all-encompassing tool that merges Business Intelligence and online reporting services. This integration enables the rapid production and distribution of large reports within minutes. Additionally, the high-quality visualization tool allows for the input of Big Data from key databases and apps. Thus making it one of the best data visualization platforms.
Get More Details Related to the Tool Here
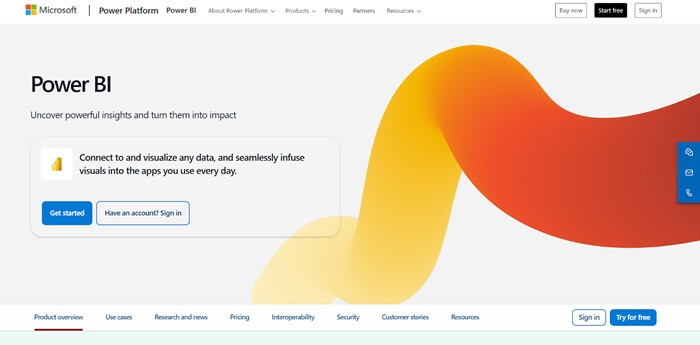
5. Microsoft Power BI
Let’s understand the next name on this list of the best data visualization software. Both in-business installation & deployment on cloud infrastructure are options for using Microsoft’s Power BI, which is a smart application that is simple to use. PowerBI is the best available. It is compatible with Google Analytics, PostgreSQL, Oracle, Adobe Analytics, Github, SQL Server, Excel, Teradata, Salesforce, and Azure. The enterprise model application generates breathtaking visuals and provides real-time information, allowing for quick decision-making inside the organization as compared to other data visualization platforms.
Get More Details Related to the Tool Here
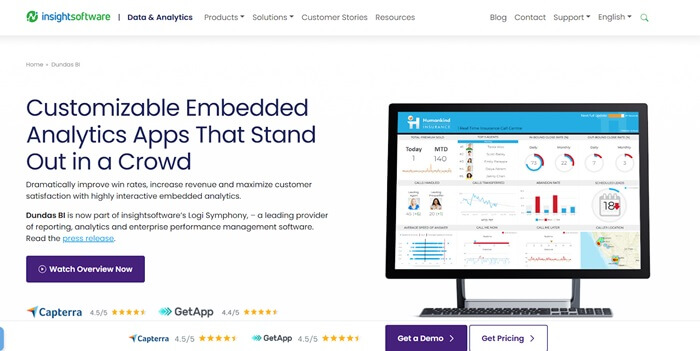
6. Dundas
Dundas Business Intelligence is a smart data visualization software that provides highly customized visualizations that include interactive maps, gauges, scorecards, and charts. These features optimize the process of creating ad hoc reports that span many pages. It is possible to simplify the complicated process of cleaning, examining, converting, and modeling large datasets using Dundas since it gives users complete control over the visual aspects as compared to the other best data visualization tools listed here.
Get More Details Related to the Tool Here
Also know: Best Free Web Scraping Tools to Extract Data
7. Tableau
Tableau is the last name on this list of the best data visualization software. Tableau is a very popular application for providing a visual representation of data for two primary reasons: it is simple to use and it is quite powerful. You are able to generate a wide spectrum of charts & maps, as well as link them to a large number of data sources. Tableau is owned by Salesforce, and it is used by a large number of individuals as well as large businesses.

Get More Details Related to the Tool Here
Which is the Best Data Visualization Platform? Final Thoughts
Firstly, there are times when choosing the most powerful data visualization software that is available is not the greatest idea: There is a possibility that a more straightforward tool might be able to produce precisely what is required in a fraction of the time, but the learning curves can be high and need more resources simply to get up and running.
Secondly, keep in mind, however, that the tool is just one component of the equation when it comes to the creation of a data visualization; designers must also take into consideration the other factors that contribute to the creation of an excellent data visualization.
Lastly, what makes any of the best data visualization tools good for any individual is its scope of offerings. Any data visualization software can be great for you if it meets all your visualization and customizing needs accurately.
If you need our help in choosing the right data visualization software that meets your needs, you can ask your queries in the comments section below. We will help you in every way.


