Best Ways to Test Your Website Speed for Better Ranking

Speed impacts the core vitals that determine a website’s ranking on the search engines. Hence, this article presents a detailed tutorial on how to perform website speed tests to make the website fast enough to rank high in the search engine result pages (SERPs).
Did you know BBC’s bounce rate (percentage of users who left the website after viewing only a single page) was over 10% because the website took a long time to load? And, needless to say, an increased bounce rate is among the top reasons a website’s ranking drops. Moreover, fast speed adds to the user experience, resulting in higher ranking and high conversion rates (the rate at which users perform a desired action).
Hence, site speed is of the utmost importance, and you can execute a speed test to know how fast or slow your website is to optimize it. However, if how to check site speed makes you puzzled, you can focus all your attention on this article.
Here, in this article, we are going to elaborate on the top ways you can check your site speed. Let us save you precious time and get started right away because despite fast website speed, making users wait for the required information can also lead to users leaving the site, and you are a valuable user we would not like to lose.
How to Check Site Speed- The Best Ways
You can follow these methods to test the speed of your website with minimal effort in the least amount of time.
Method 1: Check website performance metrics
The website speed is affected by many performance factors. Measuring various performance-related metrics helps gauge the website’s speed and take the necessary steps to improve it. Hence, let us look at the metrics you are required to measure and how to check them.
Measure the Time to First Byte (TTFB)
TTFB or Time to First Byte is the time between you or a user clicking on a web page and the browser first begins to get a response. Technically, it is how long the server takes to deliver the first data byte in response to an HTTP request. If the server data delivery takes more time, the website speed is affected adversely. For the websites to load faster and rank high in SERPs, the ideal TTFB for a website is 800ms or less.
Hence, the Time to First Byte measurement is one of the ways you can do a website speed test. You can follow these steps to measure the TTFB in Chrome.
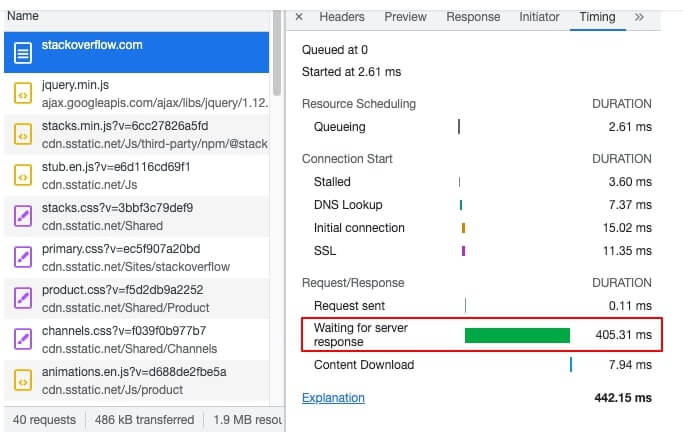
- First, navigate to the Chrome DevTools network tab to locate the HTTP Request TTFB.
- Next, select the Document request and go to the Timing tab.
- You can now view the Waiting for server response value to know your website’s Time to First Byte.
Check the First Input Delay (FID)
FID, i.e., First Input Delay is the website loading time when a user interacts with your website for the first time. Let us understand with an example, when you click on the download button on any software website’s homepage, the time the download page takes to appear, i.e., the time the browser takes to respond to your request is the First Input Delay.
A high FID indicates slow website speed. Ideally, the FID score should remain below 100 milliseconds, 100 to 300 milliseconds is an average score, and a score of more than 300 milliseconds requires immediate attention. Here is how to measure the First Input Delay of a website.
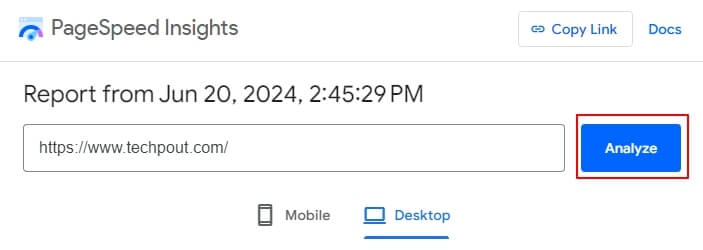
- The first step is to open the Google PageSpeed Insights tool.
- Next, enter your website URL in the on-screen box and click Analyze.
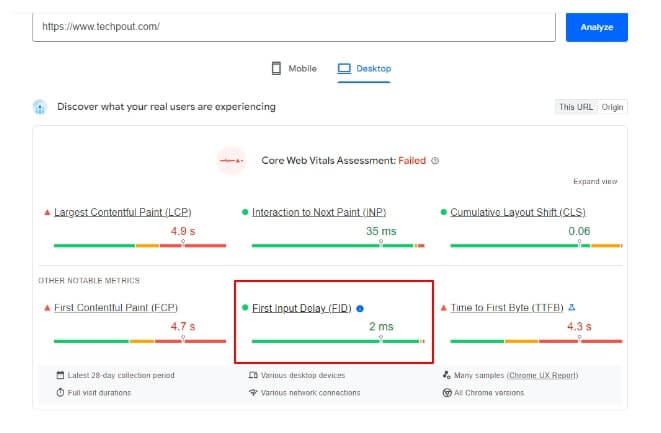
- You can now view your website’s FID score to get an idea of your website speed. For example, we have a First Input Delay (FID) of 2ms which is an acceptable score, meaning that we have an appropriate website speed.
Review the First Contentful Paint (FCP)
Another way of testing the speed of a website is by checking the First Contentful Paint or FCP. This metric shows the time a browser takes to load the first image or text on your website or webpage. In other words, it is the time gap between the start of the loading process and the displaying of the content.
Generally, an FCP of less than 1.8 seconds is considered good, 1.8 to 3 seconds is an average score, and a score of more than 3 seconds is poor. A good FCP indicates fast website speed. Hence, below is how to measure your website’s FCP.
- The first step is to open the Google PageSpeed Insights tool.
- Secondly, enter your website URL in the designated box and click Analyze.
- You can now check the First Contentful Paint (FCP) metric for your website.
Check the Largest Contentful Paint (LCP)
Next, you are required to measure the Largest Contentful Paint (LCP) to test the website speed. LCP measures the time the largest element on your page (a prominent section at the top or a big image) takes to render. Notably, it is among the three core metrics Google uses for its search rankings, Interaction to Next Paint and Cumulative Layout Shift being the other two.
Ideally, the LCP is good if it is less than 2.5 seconds, an LCP of 2.5 to 4.0 seconds has a scope for improvement, and more than 4 seconds LCP needs to be looked upon immediately. You can follow these steps to view your website’s LCP.
- First, go to the Chrome DevTools.
- Next, navigate to the Timings segment to find the Largest Contentful Paint (LCP). If you click the LCP marker, it highlights the LCP elements on your website.
Also know:Best Free AI Search Engine in 2024
View the Cumulative Layout Shift (CLS)
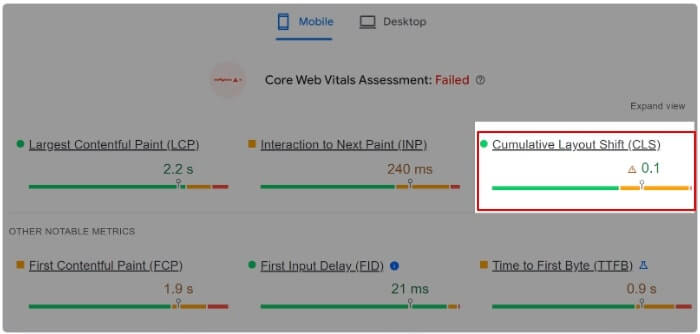
Let us take an example of our website to understand the Cumulative Layout Shift (CLS). When you open techpout.com, you may notice images appear at slightly different times and shift the other content around as they load. This content shifting is CLS. It is a metric that measures web page movements when various assets load.
A high CLS score is always bad for your website ranking, as severe and unexpected content movement can frustrate the user, lower the website speed, increase the bounce rate, and drop your website ranking. Hence, you should aim for a CLS score of less than 0.1, though anything between 0.1 to 0.25 is acceptable. You can follow these directions to measure the CLS of your website.
- First, navigate to the Google PageSpeed Insights.
- Secondly, input the URL of your website in the on-screen website and click Analyze.
- Next, you can view your website’s CLS score along with other vitals. For example, the CLS in the following screenshot is 0.1 which is an appropriate score.
Find the Time to Interactive (TTI)
TTI or Time to Interactive is the time your website or any webpage requires to become completely interactive once a user has arrived. The page is said to be fully interactive when it displays useful content, most visible page elements have registered event handlers (the automatically executed scripts when an event occurs), and the page takes no longer than 50 milliseconds to respond to user interactions.
As recommended by Google, your TTI should not exceed 5 seconds. Here is how to measure it.
- The first step requires you to access the Google PageSpeed Insights.
- Next, copy your website URL and paste it into the on-screen box.
- Lastly, click Analyze to get the Time to Interactive and other crucial metrics on your screen.
Check the Total Blocking Time (TBT)
The next metric you should know for testing website speed is the Total Blocking Time (TBT). It measures the time during which tasks longer than 50ms block the main thread and affect the page’s usability. In other words, it indicates how unresponsive your webpage is before becoming completely interactive.
Please do not confuse TBT with TII like many users do, as they sound similar. TII measures the time (in seconds) a page takes to become interactive. Whereas TBT takes into account what happens between FCP and TTI, i.e., it quantifies the delay between the page displaying the first text or image and becoming fully interactive.
An ideal TBT score, according to Google performance metrics, is less than 200 milliseconds. However, if your score is 200ms to 600ms, it requires improvement, and a score lower than 600ms should be paid instant attention. You can measure your website’s TBT by following these directions.
- First, go to the Chrome DevTools.
- Next, navigate to the Performance tab and click on the Record button.
- After the recording is complete, you can hover over the tasks in the Main section to find what scripts make your page unresponsive. And, in the footer, you can see the TBT.
View the Speed Index (SI)
Simply put, the Speed Index (SI) is a metric that measures how quickly content comes up on your website. However, do not confuse it with the Largest Contentful Paint. Unlike the Largest Contentful Paint, Speed Index takes into account the entire webpage and not a single element. Ideally, the SI should not be more than 3.4 seconds on mobile and 1.3 seconds on a desktop. You can view it by following the path Google PageSpeed Insights>Diagnose performance issues>Lab data.
The above metrics, when combined, provide an overall picture of the site’s speed. After understanding these details, you can make a targeted effort to improve the speed of your website to ensure it is fast and user-friendly.
However, if you are not too much into technical stuff and are looking for a fairly straightforward way to check the website speed, you can follow the next method.
Also know: Best SEO Techniques to Drive Organic Traffic
Method 2: Use a website speed test tool
Many tools are available on the internet for testing the speed of a website. In addition to speed testing, you can use these programs to get visitor insights and suggestions to improve your website ranking in search engines. Hence, here are some of the best paid and free website speed test tools.
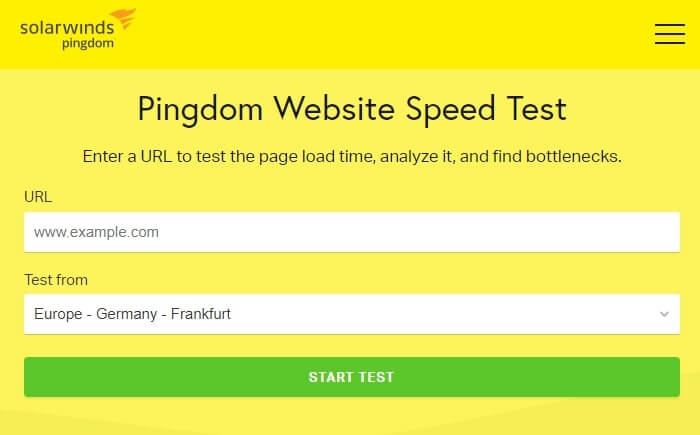
1. Pingdom
Let us introduce you to Pingdom, one of the best tools to test website speed. It tests your website from over 7 locations to reveal details, such as page size, load time, number of server requests, performance grade, and a lot more. You can run a Pingdom speed test yourself from the following link.
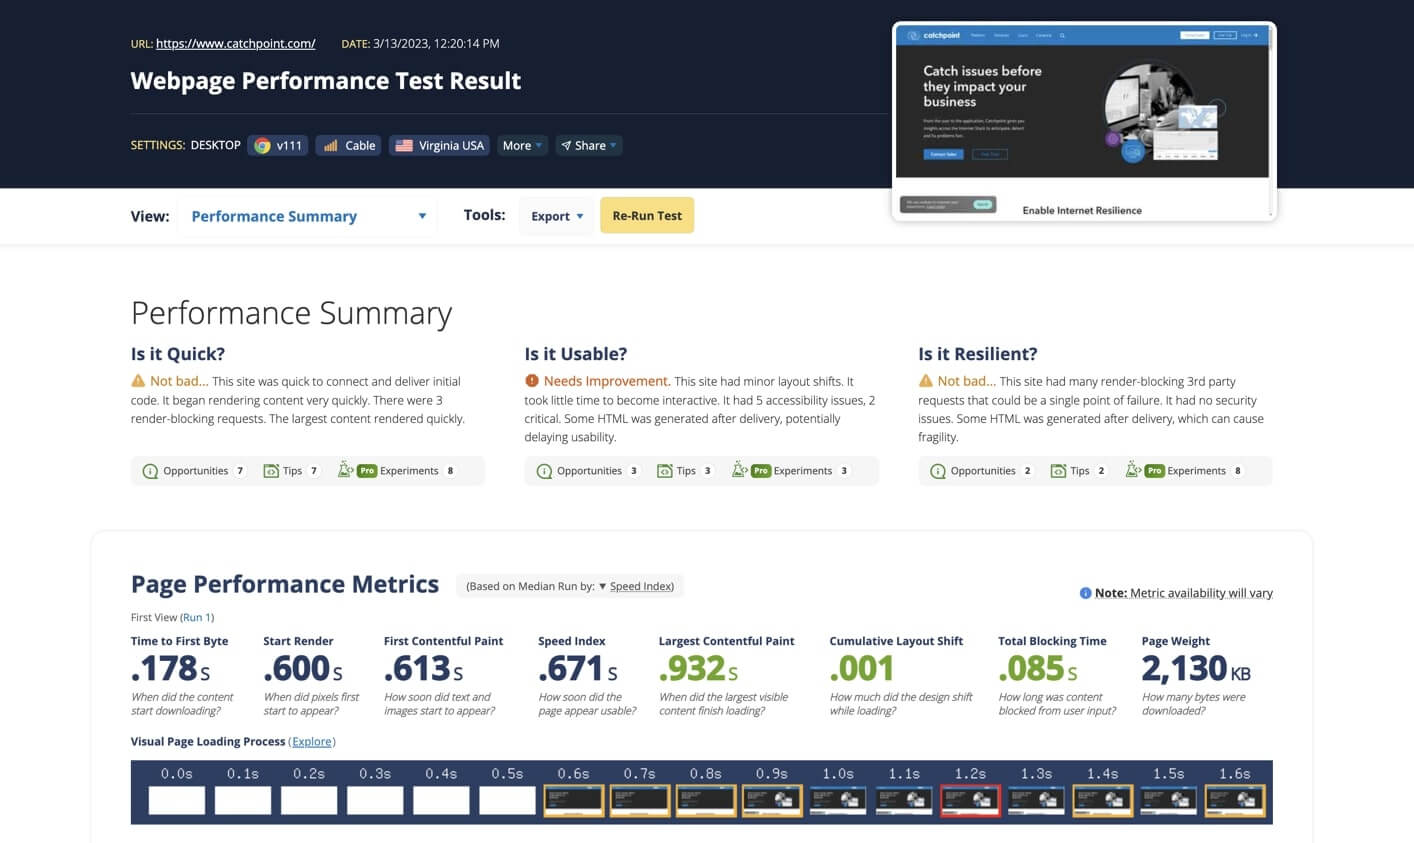
2. WebPageTest
This tool caters to the requirements of both novice and advanced users. You can run a simple or detailed website test with WebPage Test depending on what you wish to know. Moreover, this tool is renowned for its multiple-run testing, i.e., an option to conduct nine test runs simultaneously.
Furthermore, there is a visual comparison test, allowing you to test multiple URLs at the same time and view their visual comparison. It provides insight into the load time breakdown, load sequence of every webpage, dominating content types, and many other valuable details.
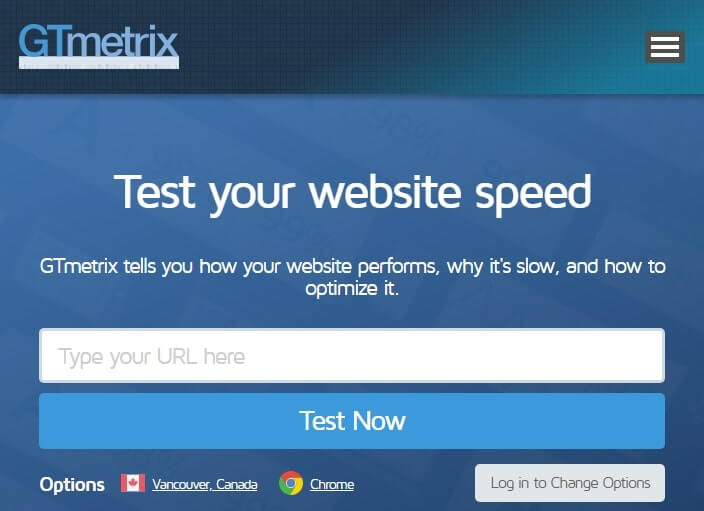
3. GTMetrix
Here is another tool to test your website speed, know how it performs, and learn ways to optimize it. GTMetrix allows you to see your page’s performance in 22 different global locations on over 40 simulated device options. You can execute a GTMetrix test through the link below to identify problems with your website for actionable gains, analyze core vitals, and get an alert whenever anything lowers the website speed.
Also know: Local SEO Practices That Will Bring in More Business
Summing Up
Ranking a website high in SERPs is no joke. It takes conscious effort, such as ensuring the website is user-friendly, for websites to rank. And, improving the website speed to make sure it meets the search engine’s core vitals and fulfills the user expectations is one crucial step towards taking your website to the top of search engine result pages. Hence, you can use the above guide to test your website speed and improve it. In case of any confusion or questions, rest assured we are here to help. You can reach out to us through the comments section anytime